

Real estate companies are increasingly interested in building portfolio intelligence dashboards using modern data tools. Many organizations use Buildium as their operational property management platform and Power BI as their reporting layer. On the surface this combination appears straightforward. Connect the Buildium API to Power BI, create dashboards, and begin visualizing portfolio performance.
However, teams quickly discover that operational systems are not designed to support analytics at scale. As portfolios grow and reporting expectations increase, simple integrations begin to fail. Dashboards become slow, data becomes inconsistent, and teams spend more time fixing reports than interpreting insights.
The challenge is not Power BI or Buildium themselves. The challenge is data architecture.
A sustainable solution requires a proper data pipeline, a structured data warehouse, and a disciplined approach to data engineering. In this article we explore how organizations can move from basic Buildium reporting to a scalable portfolio intelligence architecture using Azure Data Factory, Azure Synapse, and Power BI semantic models. We will also explore advanced approaches using Databricks, Apache Spark, and medallion architecture for organizations preparing for long term growth.
Table of Contents
- The Challenge of Portfolio Reporting with Buildium
- Understanding Operational Data vs Analytical Data
- Basic Architecture: Buildium Directly Connected to Power BI
- Why Direct Power BI Connections Do Not Scale
- Designing a Data Pipeline with Azure Data Factory
- Building a Clean Analytical Layer with SQL Warehouses
- Delivering Insights with Power BI Semantic Models
- Cost Sensitive Architecture: Buildium + ADF + Power BI
- Scalable Architecture: Buildium + Synapse + Power BI
- Advanced Analytics Architecture with Databricks and Apache Spark
- Understanding Medallion Architecture for Real Estate Data
- Portfolio Intelligence and the Future of Real Estate Analytics
The Challenge of Portfolio Reporting with Buildium
Property management platforms like Buildium are designed for operational efficiency. They manage tenant records, lease agreements, maintenance tickets, accounting transactions, and day to day property operations. These systems are optimized for transaction processing rather than analytical reporting.
As property portfolios grow, executives begin asking broader questions. They want to understand portfolio level performance across dozens or hundreds of assets. They want to track leasing velocity, maintenance costs, revenue trends, and operational efficiency across time.
These questions require portfolio intelligence dashboards, not simple operational reports.
| Portfolio Metric | Example Insight |
|---|---|
| Occupancy Rate | Compare across properties |
| Net Operating Income | Portfolio profitability trend |
| Maintenance Cost Ratio | Operational efficiency |
| Leasing Velocity | Speed of tenant acquisition |
| Tenant Satisfaction | Operational quality signals |
Many organizations attempt to answer these questions by connecting Power BI directly to the Buildium API. While this approach can produce simple dashboards quickly, it often fails once the reporting requirements become more sophisticated. Data inconsistencies appear, calculations become complex, and dashboards become slow or unreliable.
The underlying issue is that operational databases are not designed to serve analytical workloads.
To build sustainable analytics capabilities, companies must design a proper data pipeline architecture.
Understanding Operational Data vs Analytical Data
Before designing a data architecture, it is important to understand the difference between operational data and analytical data.
Operational data exists inside systems like Buildium. These systems store data in a structure optimized for performing transactions. Tables are normalized, relationships are complex, and historical data is often overwritten as records change.
Analytical data, on the other hand, is designed for exploration and reporting. Analytical models store historical snapshots, organize information around business concepts, and simplify relationships between entities like properties, leases, tenants, and financial performance.
In a proper architecture, operational data should never be used directly for analytics. Instead, data must be extracted, transformed, and modeled before it reaches visualization tools like Power BI.
This process is the foundation of data engineering.
Basic Architecture: Buildium Directly Connected to Power BI
The simplest architecture for building dashboards involves connecting Power BI directly to the Buildium API.
In this configuration, Power BI retrieves data from Buildium endpoints and performs transformations within the dashboard itself. Analysts create calculated columns, relationships, and measures using DAX functions inside Power BI.
This approach is attractive because it requires minimal infrastructure. Small portfolios can produce simple dashboards quickly using this method.
However, this architecture introduces several long term problems including inaccurate Power BI property management dashboards.
Power BI becomes responsible for data transformation, modeling, and reporting simultaneously. As dashboards grow more complex, the number of transformations increases and the semantic model becomes difficult to maintain.
Eventually, the Power BI environment becomes overloaded with calculations, joins, and transformations that should have been handled upstream in the data pipeline.
This is where the architecture begins to break down.
Why Direct Power BI Connections Do Not Scale
Direct integrations between Buildium and Power BI may work for early stage reporting, but they do not scale well for growing portfolios.
One of the primary challenges is data transformation complexity. When raw operational data flows directly into Power BI, analysts must perform extensive transformations inside the report model. These transformations include joins, aggregations, historical calculations, and complex financial metrics.
Over time, these calculations accumulate. Power BI dashboards become difficult to maintain, refresh times increase, and small schema changes can break multiple reports.
Another challenge is historical data management. Operational systems like Buildium are not designed to store analytical history. When records change, historical information can be lost unless it is captured through data pipelines.
Without historical snapshots, portfolio analytics becomes unreliable.
A scalable solution requires a proper data pipeline and warehouse architecture.
Designing a Data Pipeline with Azure Data Factory
Azure Data Factory (ADF) is a cloud based service designed to orchestrate data pipelines. It allows organizations to extract data from operational systems, transform it, and load it into structured storage environments.
In a Buildium analytics architecture, Azure Data Factory typically performs several key functions.
First, it retrieves data from the Buildium API on a scheduled basis. This process captures operational data such as property records, tenant information, maintenance requests, and financial transactions.
Next, ADF stages the data in intermediate storage where transformations can occur. During this stage, the pipeline can clean data, normalize fields, apply business rules, and capture historical snapshots.
Finally, the transformed data is loaded into an analytical database where it becomes available for reporting tools.
By introducing a dedicated data pipeline layer, organizations separate data engineering tasks from visualization tasks. This separation dramatically improves scalability and reliability.
Building a Clean Analytical Layer with SQL Warehouses
After data pipelines extract and transform operational information, the next step is storing the data in a structured analytical environment.
This environment is typically implemented as a SQL data warehouse.
A warehouse organizes information into analytical tables designed specifically for reporting. These tables may include structures such as property dimensions, tenant dimensions, lease fact tables, and financial performance metrics.
Unlike operational databases, analytical warehouses store historical snapshots and pre aggregated metrics. This allows dashboards to retrieve information quickly without performing expensive calculations at runtime.
When Power BI connects to a properly designed warehouse, it receives clean analytical data rather than raw operational records.
This is the foundation of scalable portfolio intelligence dashboards.
Delivering Insights with Power BI Semantic Models
Once data is prepared in the warehouse, Power BI becomes the visualization and semantic modeling layer.
Instead of performing heavy transformations, Power BI focuses on defining relationships between analytical tables and creating business friendly metrics. This structure is known as the Power BI semantic model.
The semantic model allows analysts to define key performance indicators such as occupancy rates, net operating income, maintenance cost ratios, and tenant retention metrics.
Because the underlying data has already been cleaned and structured, the semantic model remains lightweight and easy to maintain.
In this architecture, Power BI becomes the visualization layer rather than the data processing engine.
| Table Type | Example Tables | Purpose |
|---|---|---|
| Dimension Tables | Properties, Units, Tenants | Descriptive attributes used in filtering |
| Fact Tables | Lease Transactions, Maintenance Costs | Measurable operational events |
| Aggregation Tables | Monthly Revenue, Occupancy Metrics | Pre-calculated portfolio KPIs |
Cost Sensitive Architecture: Buildium + ADF + Power BI
Many small and mid sized property management firms are sensitive to infrastructure costs. For these organizations, a lightweight architecture built around Buildium, Azure Data Factory, SQL databases, and Power BI can provide a good balance between cost and capability.
In this architecture, Azure Data Factory handles data ingestion and transformation. Cleaned data is stored in a standard Azure SQL database, and Power BI connects to that database through a well defined semantic model.
This architecture supports moderate reporting complexity and can scale to several thousand units without requiring heavy analytics infrastructure.
However, organizations must still follow disciplined data engineering practices. Even in a cost sensitive architecture, Power BI should not be overloaded with complex transformations or excessive DAX calculations. If you are in this situation, contact us today for support migrating to a more robust architecture.
Clean analytical data should always be prepared before reaching the reporting layer.
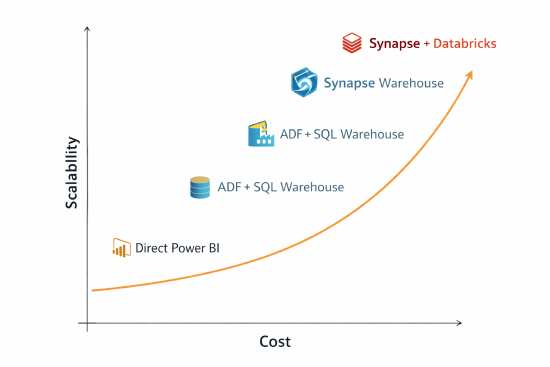
| Architecture | Components | Best For | Cost Profile | Scalability | Typical Portfolio Size |
|---|---|---|---|---|---|
| Basic Reporting | Buildium → Power BI | Small teams needing simple dashboards | Low | Limited | 100–500 units |
| Cost Sensitive Architecture | Buildium → Azure Data Factory → SQL Database → Power BI | Growing portfolios needing reliable dashboards | Moderate | Medium | 500–2000 units |
| Scalable Data Platform | Buildium → Synapse Pipelines → Synapse Warehouse → Power BI | Multi-system reporting and long-term analytics | Higher | High | 2000–10,000+ units |
| Advanced Analytics Platform | Buildium → Data Lake → Databricks / Spark → Synapse → Power BI | Institutional portfolios and predictive analytics | Enterprise | Very High | 10,000+ units |
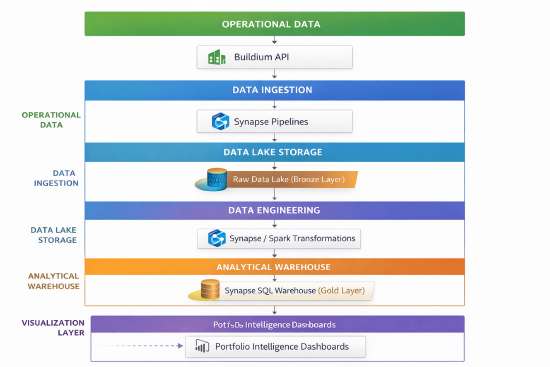
Scalable Architecture: Buildium + Synapse + Power BI
As portfolios grow and data complexity increases, organizations may require a more advanced architecture.
Azure Synapse Analytics expands upon the capabilities of Azure Data Factory by combining data integration, warehousing, and analytics services into a unified platform.
With Synapse, data pipelines can ingest information from multiple systems while storing large volumes of historical data in scalable analytical warehouses. Synapse also supports advanced data engineering workflows and distributed query processing.
For organizations managing large property portfolios or multiple real estate platforms, Synapse provides the infrastructure needed to maintain data integrity and analytical scalability.
Power BI integrates naturally with Synapse warehouses, enabling executives to explore portfolio performance across years of historical data and multiple asset classes.
Advanced Analytics Architecture with Databricks and Apache Spark
For organizations preparing for institutional scale analytics, advanced architectures may include Databricks and Apache Spark.
Databricks provides a collaborative data engineering and analytics platform built on top of the Apache Spark distributed computing engine. This environment enables large scale data processing, machine learning experimentation, and advanced analytics modeling.
Spark allows organizations to process massive datasets efficiently while supporting complex transformations across structured and unstructured data sources.
When combined with Azure Synapse or cloud data lakes, Databricks enables advanced analytics scenarios such as predictive maintenance modeling, leasing trend forecasting, and tenant behavior analysis.
Although not necessary for every portfolio, these technologies provide a foundation for organizations pursuing large scale real estate analytics platforms. Moreover these pipelines facilitate analytics and MLOPS, for companies interested in advanced insights.
Understanding Medallion Architecture for Real Estate Data
Modern data engineering practices often organize pipelines using the medallion architecture model.
This architecture divides data processing into three layers known as Bronze, Silver, and Gold.
The Bronze layer captures raw data from operational systems like Buildium. Data is ingested exactly as it appears in the source system and stored for historical reference.
The Silver layer performs data cleaning, normalization, and transformation. In this stage, duplicate records are resolved, inconsistent formats are standardized, and historical tracking is implemented.
The Gold layer produces curated analytical datasets designed specifically for reporting and analytics. These datasets contain business friendly tables that Power BI can query efficiently.
By structuring data pipelines around Bronze, Silver, and Gold layers, organizations ensure that analytics tools always receive clean, reliable analytical data.
| Layer | Purpose | Example Data |
|---|---|---|
| Bronze Layer | Raw operational data captured from Buildium | Lease records, tenant records, transactions |
| Silver Layer | Cleaned and standardized data | normalized tenant tables, property dimension tables |
| Gold Layer | Analytical datasets for reporting | occupancy metrics, revenue trends, portfolio KPIs |
Portfolio Intelligence and the Future of Real Estate Analytics
Real estate organizations are entering a new era of data driven portfolio management. Property management systems like Buildium generate large volumes of operational data, but that data must be transformed before it becomes useful for strategic decision making.
Proper data pipeline architecture, disciplined data engineering practices, and scalable analytical warehouses are essential components of this transformation.
Visualization platforms like Power BI play a critical role in delivering insights, but they must sit on top of a well designed analytical foundation. When dashboards receive clean Gold level data rather than raw operational records, they become reliable tools for understanding portfolio performance.
Organizations that invest in proper data architecture today position themselves to unlock deeper portfolio intelligence tomorrow. As portfolios expand and analytics capabilities evolve, these foundations enable the transition from simple reporting to true portfolio intelligence platforms.
| Data Maturity Level | Architecture | Typical Organization |
|---|---|---|
| Level 1: Operational Reporting | Buildium → Power BI | Small property managers |
| Level 2: Data Pipeline Architecture | Buildium → ADF → Warehouse → Power BI | Growing portfolios |
| Level 3: Portfolio Intelligence | Data Lake → Synapse → Analytics Platforms | Institutional operators |
By designing thoughtful architectures that connect Buildium data pipelines, Azure analytics infrastructure, and Power BI dashboards, real estate companies can move beyond operational reporting and toward a new generation of real estate analytics and portfolio intelligence systems.
FAQ: Buildium Power BI Integration and Data Architecture
Yes, Power BI can connect to the Buildium API, allowing dashboards to retrieve operational data such as properties, tenants, leases, and financial transactions. However, direct connections between Buildium and Power BI are typically only suitable for small reporting workloads.
Operational systems like Buildium are optimized for transaction processing rather than analytics. When Power BI retrieves raw operational data directly from the API, dashboards often become overloaded with transformations and complex calculations. As reporting requirements grow, this approach can lead to slow refresh times and difficult to maintain semantic models.
For scalable analytics, most organizations implement a data pipeline architecture that extracts Buildium data into a structured warehouse before Power BI consumes it.
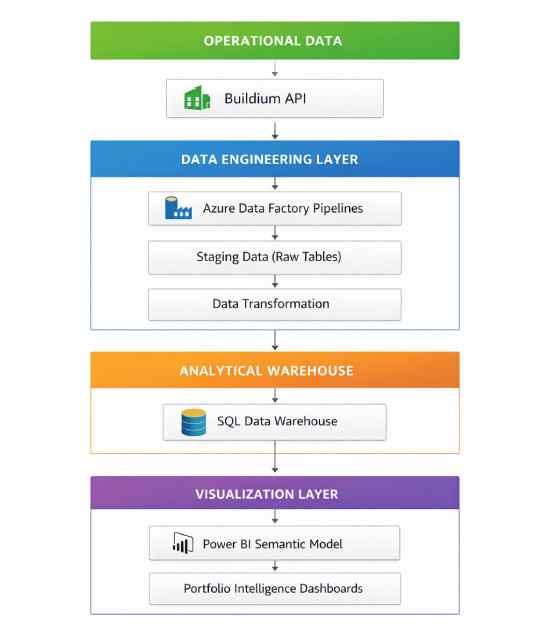
A scalable Buildium Power BI architecture typically includes a dedicated data engineering layer between the operational system and the reporting platform.
A common architecture looks like this:
- Buildium API
- Azure Data Factory pipelines
- Data staging and transformation
- SQL or Synapse data warehouse
- Power BI semantic model
In this design, Power BI receives clean analytical data instead of raw operational records. This dramatically improves dashboard performance and makes portfolio reporting more reliable.
Many Buildium dashboards struggle to scale because organizations connect Power BI directly to operational data sources. This forces the reporting environment to perform complex transformations that should be handled upstream.
Common problems include:
- large DAX calculations inside dashboards
- inconsistent data definitions
- slow refresh performance
- difficulty maintaining reports as portfolios grow
By introducing data pipelines and analytical warehouses, organizations separate data engineering from visualization, which is a key principle of scalable analytics architecture.
Modern property management analytics typically combine operational systems like Buildium with cloud data platforms such as Azure Data Factory, Synapse Analytics, and Power BI.
Data pipelines extract operational records from Buildium and transform them into structured analytical datasets. These datasets can then power dashboards that track key portfolio metrics such as occupancy rates, leasing velocity, maintenance costs, and revenue trends.
This architecture enables property management companies to move from basic reporting to portfolio intelligence dashboards that support strategic decision making.